quantedx.com

Portfolio Downside Risk

Analyzing Portfolio Downside Risk with R

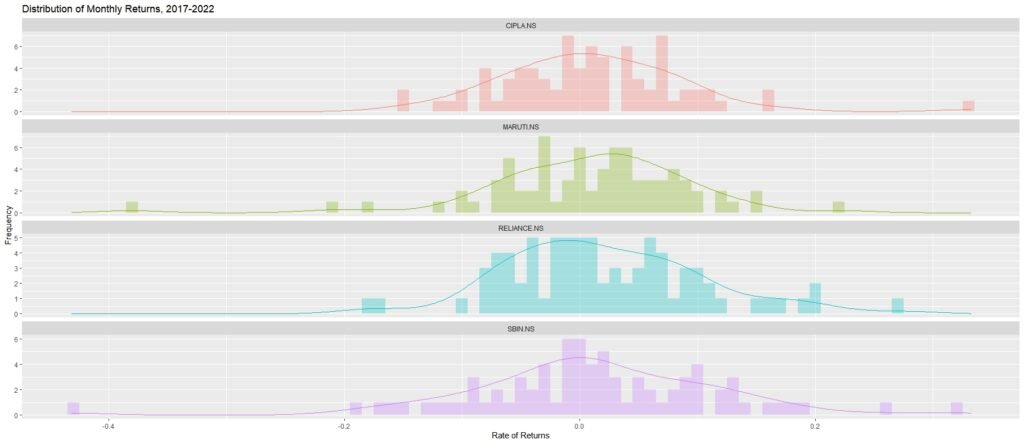
In the world of finance and investment, understanding the risk associated with your portfolio is paramount. One key aspect of risk analysis is examining downside risk, which refers to the potential for unfavorable returns or extreme losses. This is also termed as the Portfolio downside risk analysis. In this article, we will walk you through a comprehensive analysis of your portfolio’s downside risk using R, a powerful programming language for data analysis. We will explore essential statistical concepts such as kurtosis and skewness to gain insights into how your portfolio’s risk has evolved over time. Also, read Optimizing Investment using Portfolio Analysis in R What is Kurtosis? Kurtosis is a statistical measure that describes the distribution of returns in a portfolio. It measures the “tailedness” of the distribution, indicating whether the data has heavy tails or light tails compared to a normal distribution. Kurtosis helps investors assess the risk associated with extreme returns. The formula for kurtosis (K) is as follows: Where: Interpreting Kurtosis What is Skewness? Skewness measures the asymmetry of the distribution of returns in a portfolio. It helps investors understand whether the portfolio is more likely to experience positive or negative returns and the degree of asymmetry. The formula for skewness (S) is as follows: Where the variables are the same as in the kurtosis formula. Interpreting Skewness How to calculate Portfolio Downside Risk, Kurtosis and skewness using R Step 1: Load the Necessary Packages To begin, we load the essential R packages, including tidyverse and tidyquant, which provides a wide range of tools for data manipulation and financial analysis. Step 2: Define Your Portfolio and time frame Select the stocks you want to include in your portfolio and specify the start and end dates for your analysis. Step 3: Import Stock Prices Retrieve historical stock price data for the chosen stocks within the specified timeframe. Step 4: Calculate Monthly Returns Compute monthly returns for each asset in your portfolio using a logarithmic transformation and Assign weights to each asset in your portfolio, reflecting the allocation of investments. Step 5: Build the Portfolio and Assign Portfolio Weights Construct the portfolio using the assigned weights, and ensure that returns are rebalanced on a monthly basis to simulate real-world scenarios. Step 6: Compute Kurtosis and Rolling Kurtosis Calculate the kurtosis of the portfolio’s returns, a measure that quantifies the risk associated with extreme values. Compute and visualize rolling kurtosis to observe changes in downside risk over time. Step 7: Analyze Skewness and Return Distributions Calculate the skewness of individual assets and the portfolio, and visualize the distribution of returns for each asset. Now, let’s delve into the meaning of the terms and the insights we’ve gained: Kurtosis: Kurtosis measures the distribution of returns. A higher kurtosis indicates a riskier distribution with the potential for extreme returns, both positive and negative. If the portfolio kurtosis is greater than 3, it suggests a higher risk of extreme returns. A positive portfolio skewness indicates a potential for positive outliers, while a negative skewness suggests a higher likelihood of negative outliers. Rolling Kurtosis: This plot shows how the downside risk of the portfolio has changed over time. Peaks indicate periods of increased risk. Skewness: Skewness assesses the symmetry of return distributions. Negative skewness suggests more downside risk, while positive skewness indicates more upside potential. We observed that the portfolio’s downside risk improved slightly over the past year. During the pandemic, the portfolio experienced a surge in kurtosis, indicating high risk. However, recent data shows a negatively skewed distribution with lower kurtosis, signaling reduced risk. While historical data showed unattractive prospects, the portfolio now offers more consistent returns. For more such Projects in R, Follow us at Github/quantifiedtrader What does higher portfolio kurtosis mean? When the portfolio kurtosis is higher, it means that the distribution of returns in the portfolio has heavier tails compared to a normal distribution. In other words, the portfolio has a higher probability of experiencing extreme returns, both positive and negative. Here’s what a higher portfolio kurtosis implies: A higher portfolio kurtosis suggests that the portfolio’s returns are more volatile and that investors should be cautious about the potential for extreme outcomes, both positive and negative. It often indicates a higher level of risk associated with the investment. what does higher portfolio skewness mean? A higher portfolio skewness means that the distribution of returns in the portfolio is skewed towards one side of the mean (average). Specifically: Here’s what a higher portfolio skewness means: A higher portfolio skewness provides insights into the distribution of returns and how they are skewed relative to the mean. Positive skewness suggests more frequent small positive returns, while negative skewness suggests more frequent small negative returns. Understanding skewness is valuable for investors in managing their portfolios and assessing potential risks and rewards. Conclusion Understanding and monitoring downside risk is essential for making informed investment decisions. Through R and statistical measures like kurtosis and skewness, you can gain valuable insights into your portfolio’s risk profile and make adjustments accordingly.

Analyzing Portfolio Downside Risk with R Read More »

A Comprehensive Guide on Factor Investing for maximum profits

Factor investing is a dynamic strategy that can supercharge your investment portfolio. It’s all about selecting securities based on specific attributes linked to higher returns. But what exactly is factor investing, and how can it benefit you? Let’s dive in. Unpacking Factor Investing At its core, factor investing aims to enhance diversification, generate returns that outperform the market, and manage risk. It’s a strategy that goes beyond traditional portfolio allocations, like the classic 60% stocks and 40% bonds mix. Instead, factor investing hones in on a variety of factors that have historically driven returns in the world of stocks, bonds, and other assets. What is Factor and Factor Analysis? Why is Factor Analysis Important? The Two Main Types of Factors Factor investing divides these factors into two main categories: Macroeconomic Factors: These factors capture broad risks across asset classes. Think of them as the big-picture drivers of returns. They include economic indicators like inflation rates, GDP growth, and unemployment rates Macroeconomic Factors: Explain risks across asset classes. Macro Factors Core Macro Secondary Macro Style Factors: In contrast, style factors explain returns and risks within asset classes. They include attributes like growth versus value stocks, market capitalization, and industry sector. Factor investing is a robust strategy that harnesses macroeconomic and style factors to build an investment strategy. Investors have identified various factors, including growth vs. value, market capitalization, credit rating, and stock price volatility, among others. These factors are the building blocks of factor investing, and they can significantly impact your portfolio’s performance. Style Factors: Explain risks and returns within asset classes. Style Factors Macro Styles Equity Styles What is a Smart Beta Strategy? One common application of factor investing is known as “smart beta.” Smart beta strategies leverage these factors to construct portfolios that aim to beat the market’s average return. They target market anomalies or risks that command higher risk premiums than the overall market. Smart Beta2 strategies Smart beta investing seeks to derive a return from risk premia in the market; smart beta factors tend to be well-known and easier to implement. For example, the “momentum” factor is well known and is based on the belief that stocks that have recently increased in price may continue to increase in price due to the bandwagon effect. Constructing Smart Beta Strategies What are the Foundations of Factor Investing? Now that we’ve laid the groundwork, let’s delve deeper into some of the core factors that power factor investing: Diversification and Factor Investing What are the examples of Factor Investing? The Fama-French 3-Factor Model Developed by economists Eugene Fama and Kenneth French, this model builds on the Capital Asset Pricing Model (CAPM). It incorporates three key factors: size of firms (SMB), book-to-market values (HML), and excess return on the market. In this model, SMB accounts for publicly traded companies with small market caps that generate higher returns, while HML accounts for value stocks with high book-to-market ratios that outperform the market. The Smart Beta Revolution Smart beta strategies, rooted in factor analysis methodologies, aim to capitalize on these factors by constructing alternative indices. For example, a smart beta exchange-traded fund (ETF) with a momentum bias tracks stocks reflecting high momentum. These strategies are implemented through proprietary indices, often referred to as “self-indexing.” Additional Factors While we’ve covered some common factors, there are numerous others believed to drive greater long-term returns. These factors tend to be relatively uncorrelated, making them valuable tools for smoothing returns and controlling volatility. Factor Investing’s Diversification Advantage Diversification has long been a cornerstone of portfolio management. However, traditional diversification across asset classes may not be as effective as once believed, as these classes often move in tandem during market fluctuations. Factor investing offers an alternative approach. By focusing on underlying factors that behave differently under various market conditions, it promotes true diversification by factors rather than by asset classes. A Historical Perspective Factor analysis methods have been in use for decades, with early research dating back to 1934 when the value factor was identified by Graham and Dodd in their paper, “Security Analysis.” Exploring Factor-Based Strategies Factor-based strategies can be implemented in various ways, including leveraging or short-selling funds or indices. Risk premia strategies, for instance, target absolute returns through long-short investments. Alpha overlay strategies diversify by targeting different underlying factors. What is Equity Factor Investing Equity factor investing is a systematic and strategic approach to evaluating companies. At its core, this investment strategy aims to identify companies that stand out based on specific factors and then rank them against their peers. The Essence of Equity Factor Investing At its heart, equity factor investing is about going beyond surface-level analysis when assessing companies. Instead of solely relying on traditional metrics like earnings or price-to-earnings ratios, factor investing delves deeper. It examines a range of factors that can influence a company’s performance. These factors can encompass a wide array of attributes, such as: The Ranking Process Equity factor investing involves a systematic process of assessing and ranking companies based on these factors. This process can help identify those companies that appear more attractive from an investment perspective. For example, if a company scores well across multiple factors, it may receive a higher ranking. Conversely, a company that lags in these areas might receive a lower rank. This ranking system provides investors with a clearer picture of which companies are potentially more promising within a given investment universe. Alpha Opportunity One of the key reasons investors turn to equity factor investing is the pursuit of alpha. Alpha represents the excess return generated by an investment compared to a benchmark index. In simple terms, it’s the measure of how much an investment has outperformed or underperformed expectations. When higher-ranked companies emerge from the factor analysis, they may signal an opportunity for alpha. In other words, investors believe these companies have the potential to outperform the broader market. Equity alpha strategies typically seek to generate an informational advantage by utilizing various datasets to help identify securities that are priced too low or too

A Comprehensive Guide on Factor Investing for maximum profits Read More »

A Guide to Arbitrage Pricing Theory (APT)

In the ever-evolving world of finance, having effective tools to evaluate investment opportunities is paramount. One such tool that has gained prominence alongside the Capital Asset Pricing Model (CAPM) is the Arbitrage Pricing Theory (APT). In this article, we’ll delve into the APT, exploring its concepts, mathematical formulation, modern-day applications, and how it complements traditional models. Understanding Arbitrage Pricing Theory (APT): Arbitrage Pricing Theory (APT) is a multifactor model developed by Stephen Ross in the 1970s. Unlike CAPM, which relies on a single systematic risk factor (market risk), APT considers multiple sources of risk. It posits that an asset’s expected return is influenced by various macroeconomic and financial factors, making it more versatile in capturing market complexities. The APT model is expressed as follows: The APT model can accommodate various risk factors, such as interest rates, inflation, exchange rates, and industry-specific variables. Each βj​ represents the asset’s sensitivity to a particular risk factor. Modern-Day Applications: APT is widely used in finance for several reasons: Complementing Traditional Models: While APT offers a broader perspective on asset pricing, it is often used alongside traditional models like CAPM. APT can capture additional risk factors that CAPM may overlook, providing a more nuanced understanding of asset pricing dynamics. Conclusion: Arbitrage Pricing Theory (APT) is a powerful tool in the world of finance. With its ability to consider multiple risk factors, it offers a more comprehensive view of asset pricing, making it a valuable complement to traditional models like CAPM. By understanding and applying APT, investors and analysts can unlock deeper insights into investment opportunities and risk management strategies, enhancing their decision-making processes.

A Guide to Arbitrage Pricing Theory (APT) Read More »

Modern Portfolio Theory (MPT): A Comprehensive Guide

Modern Portfolio Theory (MPT) is a groundbreaking concept in the world of finance that revolutionized the way investors approach risk and return. Developed by economist Harry Markowitz in the 1950s, MPT has since become a cornerstone of portfolio management. In this article, we will delve into the historical details, mathematical formulation, and key concepts related to Modern Portfolio Theory, offering a comprehensive understanding of this fundamental financial framework. Historical Background Modern Portfolio Theory emerged during a period of economic and financial turbulence in the mid-20th century. Harry Markowitz, in his pioneering work, sought to address the fundamental challenge faced by investors: how to maximize returns while minimizing risk. Prior to MPT, investors typically made decisions based solely on the expected returns of individual assets. However, this approach failed to account for the critical relationship between asset returns and their correlations, leading to inefficient and often risky portfolios. Markowitz’s Mathematical Formulation At the core of Modern Portfolio Theory lies a mathematical framework that quantifies the trade-off between risk and return. The key mathematical concept is the efficient frontier, which represents the set of portfolios that offer the maximum expected return for a given level of risk or the minimum risk for a given level of expected return. This concept is expressed through the following formula: Key Concepts in Modern Portfolio Theory Risk Diversification Risk diversification is a crucial concept in finance and investment, which aims to minimize the overall risk associated with holding a portfolio of investments by spreading resources across different assets or asset classes. This strategy is grounded in the idea that different assets often react differently to economic and market events. By holding a variety of investments, investors can reduce the impact of poor performance in any single asset on the overall portfolio. Mathematically, risk diversification can be expressed using the concept of portfolio variance. The formula for calculating the variance of a portfolio consisting of two assets (Asset 1 and Asset 2) is as follows: The portfolio variance formula highlights how the diversification effect works. When assets have a positive covariance (they tend to move in the same direction), the third term in the formula (the covariance term) increases the portfolio variance. However, when assets have a negative or low covariance (they move differently or in opposite directions), the covariance term helps reduce the portfolio variance. Therefore, by holding assets with low or negative correlations, investors can achieve a more diversified portfolio with lower overall risk. In practice, this mathematical representation extends to portfolios with more than two assets, where the formula becomes more complex due to the need to account for the covariances between all pairs of assets in the portfolio. Modern portfolio optimization tools and software use these principles to construct well-diversified portfolios that aim to achieve the desired risk-return trade-offs. Efficient Frontier The efficient frontier is a fundamental concept in Modern Portfolio Theory (MPT) that plays a central role in helping investors make informed decisions about their portfolios The efficient frontier is a graph or curve that represents a set of portfolios that achieve the highest expected return for a given level of risk or the lowest risk for a given level of expected return. In essence, it illustrates the trade-off between risk and return that investors face when constructing their portfolios. The efficient frontier demonstrates the principle that, in general, higher expected returns come with higher levels of risk. However, it also highlights that there is no single “optimal” portfolio; instead, there is a range of portfolios that offer various risk-return combinations along the curve. The risk component of the efficient frontier is typically measured using standard deviation or variance. Standard deviation quantifies the volatility or dispersion of returns, with higher values indicating greater risk. By optimizing the portfolio to minimize standard deviation, investors aim to minimize risk. The process of constructing a portfolio on the efficient frontier is known as portfolio optimization. It involves determining the allocation of assets (weights) in the portfolio to achieve a specific risk-return target. A key result related to the efficient frontier is the Two-Fund Separation Theorem. It states that investors can choose any combination of a risk-free asset (e.g., government bonds) and a portfolio on the efficient frontier to meet their risk-return preferences. This separation simplifies the investment decision by separating the choice of risky assets from the choice of risk-free assets. The point on the efficient frontier that represents the entire market is known as the market portfolio. This is the portfolio that includes all investable assets and is often used as a benchmark in portfolio construction. Investors’ preferences for risk and return are unique, and the efficient frontier allows them to choose portfolios that align with their utility function. A utility function quantifies an investor’s preferences and risk tolerance, helping them select the optimal portfolio. The shape and location of the efficient frontier can change over time due to shifts in market conditions, asset returns, and correlations. Therefore, it’s essential for investors to periodically review and adjust their portfolios to stay on or near the efficient frontier. Covariance Covariance is a statistical measure that quantifies the degree to which two random variables change together. In simpler terms, it tells us how two variables move in relation to each other. It’s an important concept in statistics and finance, particularly in portfolio theory and risk management. Here’s an explanation of covariance: Covariance measures the directional relationship between two random variables. There are three possible scenarios: Correlation It is a statistical measure that quantifies the strength and direction of the linear relationship between two continuous random variables. It tells us how closely and in what direction two variables tend to move together. Correlation is expressed as the correlation coefficient, often denoted as ρ (rho) for the population correlation or r for the sample correlation. The mathematical formula for the sample correlation coefficient (r) is as follows: Capital Allocation Line (CAL) The Capital Allocation Line (CAL) is a concept in finance that represents the trade-off between risk

Modern Portfolio Theory (MPT): A Comprehensive Guide Read More »

Basics of Quantitative Analysis

The ever-evolving landscape of finance demands that quantitative analysts stay at the forefront of knowledge and innovation. In the realm of portfolio management, recent developments have propelled the field into new territories, blending traditional financial theories with cutting-edge quantitative methodologies. This collection of several topics serves as a comprehensive guide for quantitative analysts, equipping them with the necessary expertise to navigate the complexities of modern portfolio management. We have categorized these topics into various domains, encompassing mathematical foundations, financial theories, quantitative methods, risk management, asset classes, and much more. Whether you’re an aspiring quantitative analyst looking to build a solid foundation or a seasoned professional seeking to stay updated with the latest trends, these topics cover a vast spectrum of knowledge essential for understanding and implementing advanced portfolio management strategies. As the quantitative finance field continues to evolve, it becomes increasingly vital for practitioners to adapt and grow with it. This compendium of topics aims to empower quantitative analysts with the knowledge and skills required to not only comprehend but also shape the future of portfolio management in a rapidly changing world of finance.   Mathematical Foundations Linear Algebra for Portfolio Optimization Advanced Calculus Stochastic Calculus Time Series Analysis Multivariate Statistics Optimization Techniques Monte Carlo Simulation Copula Models in Risk Management Bayesian Statistics in Portfolio Analysis Non-parametric Statistics in Asset Pricing Financial Theories Modern Portfolio Theory (MPT) Capital Asset Pricing Model (CAPM) Arbitrage Pricing Theory (APT) Black-Litterman Model Fama-French Three-Factor Model Multi-Factor Models in Asset Pricing Behavioral Finance Theories Factor Investing Risk Parity Strategies Style Analysis Quantitative Methods Factor Analysis in Risk Models Copula-Based Portfolio Risk Models Volatility Forecasting Models Time-Varying Risk Models Machine Learning in Portfolio Management Deep Learning Applications in Finance Natural Language Processing (NLP) for Market Sentiment Analysis High-Frequency Trading Strategies Algorithmic Trading Systems Transaction Cost Analysis (TCA) Portfolio Optimization Mean-Variance Optimization Alternative Risk Measures (CVaR, Max Drawdown) Black-Litterman Portfolio Construction Risk-Based Portfolio Allocation Portfolio Rebalancing Strategies Tail Risk Hedging Minimum Variance Portfolios Risk Budgeting Techniques Smart Beta Strategies Multi-Objective Portfolio Optimization Asset Classes Equity Valuation Models Fixed-Income Analysis Real Estate Investment Strategies  Commodity Trading Strategies Alternative Investments (Private Equity, Hedge Funds) Currency Markets and Trading Cryptocurrency Investment Analysis Credit Risk Modeling for Bonds Mortgage-Backed Securities (MBS) Analysis Structured Products Evaluation Risk Management Value at Risk (VaR) Models Conditional Value at Risk (CVaR) Estimation Stress Testing for Portfolios Credit Risk Assessment Liquidity Risk Management Operational Risk Frameworks Counterparty Risk Measurement Systemic Risk Analysis Regime-Switching Models for Risk Extreme Value Theory (EVT) Factor Analysis and Models Factor Identification in Equity Markets Principal Component Analysis (PCA)  Factor Investing Strategies Risk Factor Models Smart Beta ETFs Factor Timing Strategies Machine Learning in Factor Models Economic Factors and Predictive Models Factor-Based Fixed-Income Portfolios Real Assets and Factor Exposure Algorithmic Trading Strategies Statistical Arbitrage High-Frequency Trading Algorithms Market Making Strategies Order Execution Algorithms Market Impact Models Algorithmic Trading Risk Management Quantitative Momentum Strategies Pairs Trading Market Microstructure Analysis Sentiment-Based Trading Strategies Market Data and Technology Data Cleaning and Preprocessing Data Visualization Tools Cloud Computing for Quantitative Analysis Big Data Technologies Tick Data Analysis Time-Series Databases Streaming Data Analysis Alternative Data Sources High-Performance Computing (HPC) Blockchain Technology in Finance Regulatory Compliance Basel III and Banking Regulations Dodd-Frank Act MiFID II and European Regulations GDPR in Data Privacy Anti-Money Laundering (AML) Compliance Market Surveillance Technologies Algorithmic Trading Regulations Cryptocurrency Regulations ESG Reporting and Compliance Risk Reporting Requirements Behavioral Finance Behavioral Biases in Investment Decisions Prospect Theory in Risk Assessment Herding Behavior in Markets Sentiment Analysis in Trading Noise Trading Behavioral Factors in Portfolio Management Investor Psychology Behavioral Finance and Asset Pricing Anomalies and Market Efficiency Behavioral Factors in Risk Management Economic Indicators and Macroeconomics Economic Cycles and Business Conditions Leading, Lagging, and Coincident Indicators Inflation Metrics and Analysis Unemployment Rate and Its Impact Gross Domestic Product (GDP) Analysis Interest Rate Movements and Yield Curve Analysis Exchange Rates and Currency Movements Global Economic Events and Impact Fiscal Policy and Government Intervention Central Bank Policies and Tools Alternative Investments Private Equity Valuation Hedge Fund Strategies Venture Capital Investment Analysis Real Assets in Portfolio Diversification Infrastructure Investments Private Debt and Credit Investments Distressed Asset Investing Sovereign Wealth Funds Fund of Funds (FoF) Strategies Secondary Market Transactions in Alternatives Artificial Intelligence in Finance Machine Learning Algorithms for Asset Selection Natural Language Processing (NLP) in Finance Deep Learning in Portfolio Optimization Reinforcement Learning in Trading Generative Adversarial Networks (GANs) in Finance AI-Powered Chatbots for Customer Service Robo-Advisors and AI-Driven Investment Advice Explainable AI in Risk Management AI Ethics and Bias Mitigation Quantum Computing in Finance Portfolio Performance Analysis Risk-Adjusted Performance Metrics Portfolio Attribution Analysis Alpha and Beta Decomposition Portfolio Turnover Analysis Performance Benchmarks Performance Reporting Tools Post-Trade Analysis Peer Group Comparison Drawdown Analysis Stress Testing Portfolio Performance Regime-Switching Models Hidden Markov Models (HMM) Regime Detection Techniques State-Space Models Time-Varying Volatility Models Threshold Autoregressive Models Regime-Based Portfolio Strategies Regime-Dependent Risk Management Bayesian Methods for Regime-Switching Regime-Switching in Fixed-Income Markets Regime-Switching in Commodity Markets Factor Investing in Fixed-Income Fixed-Income Factor Models Yield Curve Factors Credit Spread Factors Liquidity Factors in Bonds Inflation Factors Term Structure Factors Factor Investing in Corporate Bonds Fixed-Income Factor ETFs Fixed-Income Smart Beta Strategies Dynamic Factor Rotation in Bond Portfolios Volatility Trading Strategies Volatility Risk Premium Volatility Index (VIX) Analysis Volatility ETPs (Exchange-Traded Products) Volatility Trading Strategies with Options Volatility Risk Parity Volatility of Volatility (VOL-of-VOL) Models Implied vs. Historical Volatility Volatility Skew and Smile Analysis Volatility Arbitrage Strategies Volatility Timing Models Credit Risk Modeling Credit Default Swap (CDS) Pricing Credit Scoring Models Credit Risk Analytics for Loans Credit Risk in Derivatives Credit Risk Stress Testing Recovery Rate Estimation Credit Risk Valuation Adjustments (XVA) Credit Risk Factors and Sensitivity Analysis Machine Learning in Credit Risk Credit Risk Management in Banks Asset Allocation Techniques Tactical Asset Allocation (TAA) Strategic Asset Allocation (SAA) Dynamic Asset Allocation Risk-Parity-Based Asset Allocation Goal-Based Asset Allocation Optimization Techniques in Asset Allocation Asset Allocation for Retirement Portfolios Liability-Driven Investment (LDI) Factor-Based Asset Allocation Alternative Asset Allocation Strategies Private Equity Valuation Private Equity Fund

Basics of Quantitative Analysis Read More »

Scroll to Top